


The meme that is destroying Western civilisation Part IX
How government "saving for a rainy day" has precipitated Economic Cyclones

In the last post (Substack; Patreon), I showed that government deficits enable the private sector to be in positive financial equity. But governments, driven by both (displaced) moral indignation and (erroneous) economic theory, have often strived to achieve zero government debt and positive financial equity. How has that worked out?
In a word, badly. If reducing government debt was good for the economy, then strong growth should follow periods where the government has run surpluses and therefore reduced its debt level. In fact, Depressions have occurred instead.
According to mainstream economics, reducing government debt by running surpluses should leave more savings for the private sector to invest for growth—as Mankiw put it:
the government finances the additional spending … by reducing public saving. With private saving unchanged, this government borrowing reduces national saving… a reduction in national saving is represented by a leftward shift in the supply of loanable funds available for investment… the increase in government purchases causes the interest rate to increase and investment to decrease. Government purchases are said to crowd out investment.(Mankiw 2016, p. 73)
The top plot in Figure 1 shows the government debt to GDP ratio since 1790—data which is available from the Congressional Budget Office—and private debt to GDP since 1834—data which is available from the BIS since 1945 and the US Census from 1834 till 1970. The greatest economic downturns in America’s history—the “Panic of 1837”, the Depression of 1873, the Great Depression, and the Global Financial Crisis—all occurred after the government had managed to reduce its debt to GDP ratio. The vertical bars indicate in Figure 1 show when these crises began, and all of them followed periods of substantial reductions of government debt—to zero percent of GDP in the case of the Panic of 1837.
The bottom plot in Figure 1 shows private sector debt—something that mainstream economics says it’s OK to ignore—and you’ll note that periods of falling government debt often coincide with periods of rising private debt. Then during the crises themselves, private debt plunges.
Figure 1: Government debt, private debt, and serious economic downturns

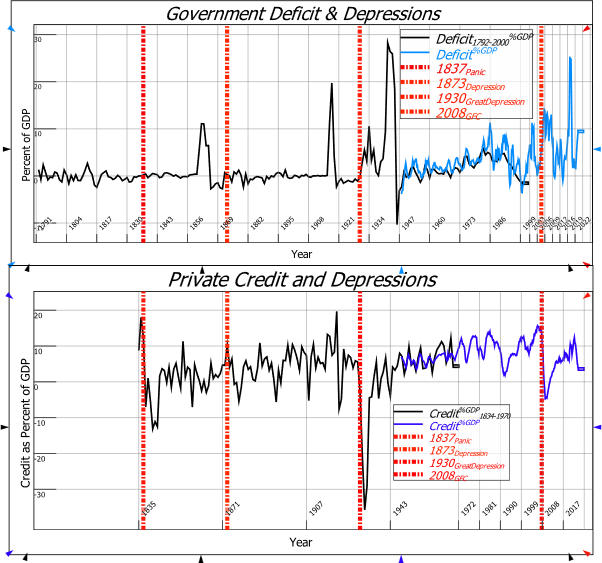
The top plot in Figure 2 shows the annual budget deficit, and these crises were preceded by periods when the government ran surpluses rather than deficits. According to mainstream economic theory, this is adding to national savings, which should enable the economy to perform better. But instead, it led to severe economic crises.
The bottom plot in Figure 2 shows the real story. A period of falling government debt reduced the amount of fiat money in the economy, which reduced the positive financial equity of the non-government sector. This led to the private sector compensating for a while by borrowing more credit money into existence. This credit money was primarily used to speculate on nonfinancial assets—shares in the 1920s, property in the early 2000s Subprime Bubble. These bubbles then burst, and a serious downturn occurred as private debt was either paid down rapidly, or not repaid at all, both of which destroyed credit money. The economy crashed into a Depression, which in the post-WWII period, has led to a rise in government spending which attenuated the downturn.
Figure 2: Government deficits, private credit, and serious economic downturns
The data is clear: following mainstream economic advice is bad for your economic health. The clearest instance of this is the biggest crisis of all—the Great Depression. It was preceded by a decade of the government running a 1% of GDP surplus, which President Coolidge thought was the reason that the economy boomed in the 1920s. His final State of the Union Address lauded these surpluses as the cause of the prosperity of the 1920s, and his sentiments would definitely get the economics textbook seal of approval:
No Congress of the United States ever assembled … has met with a more pleasing prospect than that which appears at the present time…
We have substituted for the vicious circle of increasing expenditures, increasing tax rates, and diminishing profits the charmed circle of diminishing expenditures, diminishing tax rates, and increasing profits.
Four times we have made a drastic revision of our internal revenue system… Each time the resulting stimulation to business has so increased taxable incomes and profits that a surplus has been produced. One-third of the national debt has been paid… It has been a method which has performed the seeming miracle of leaving a much greater percentage of earnings in the hands of the taxpayers 'with scarcely any diminution of the Government revenue. That is constructive economy in the highest degree. It is the corner stone of prosperity. It should not fail to be continued.
This action began by the application of economy to public expenditure. If it is to be permanent, it must be made so by the repeated application of economy… Last June the estimates showed a threatened deficit for the current fiscal year of $94,000,000… The combination of economy and good times now indicates a surplus of about $37,000,000. This is a margin of less than 1 percent of our expenditures … It is necessary therefore … to refrain from new appropriations … otherwise, we shall reach the end of the year with the unthinkable result of an unbalanced budget. For the first time during my term of office we face that contingency. I am certain that the Congress would not pass and I should not feel warranted in approving legislation which would involve us in that financial disgrace. (Coolidge 1928. Emphasis added)
Coolidge avoided the “financial disgrace” of a deficit, and a year later, the Great Depression began. I’ll explain what caused both the 1920s boom and the 1930s bust in the next post, using the Minsky system dynamics program I invented, which is now contained in the Business Intelligence program Ravel.
A quick commercial
Ravel has just been released via Patreon—see https://www.patreon.com/ravelation. Figure 3 shows the Ravel file that was used to produce the plots in this post, with all the analysis needed to produce the graphs in this post performed by a few easy-to-read flowchart formulas. Imagine doing that with a spreadsheet: how many unintelligible cell-reference-formulas would you need?
Live demonstration of Ravel
I’m giving a live demonstration of Ravel on Tuesday July 16th at 6pm London time. Go to LinkedIn or YouTube to sign up:
Click “Notify Me” on YouTube:
https://www.youtube.com/live/MbIl-WWrq4k?si=kJnao9kqgtOEV8wU
https://www.linkedin.com/events/thespreadsheetkiller-ravel7217234807347437568/theater/
All attendees will get a free copy of Ravel
Figure 3: The data analysis for this post was done in Ravel

Free subscribers: if Substack’s $5/month is too much, consider supporting me via Patreon for as little as $1/month or $10/year: https://www.patreon.com/ProfSteveKeen.
Coolidge, Calvin. 1928. "State of the Union Address: Calvin Coolidge (December 4, 1928)." In.
Mankiw, N. Gregory. 2016. Principles of Macroeconomics, 9th edition (Macmillan: New York).