
Triggering Crises by Reducing Government Debt. Chapter 05 of Money and Macroeconomics from First Principles, for Elon Musk and Other Engineers
What Musk thinks will revive the economy is more likely to trigger a serious recession

The beliefs that the State faces a fiscal crisis if its debt gets too high, and that it is prudent for the government to reduce its debt by running surpluses rather than deficits, have existed since the dawn of the Republic. The empirical record of such attempts is definitive, and runs contrary to the expectations of governments at those times. A serious crisis, triggered by a private debt bubble and crash, has followed every sustained attempt to reduce government debt. This can be seen by comparing data on government and private debt back to 1834.
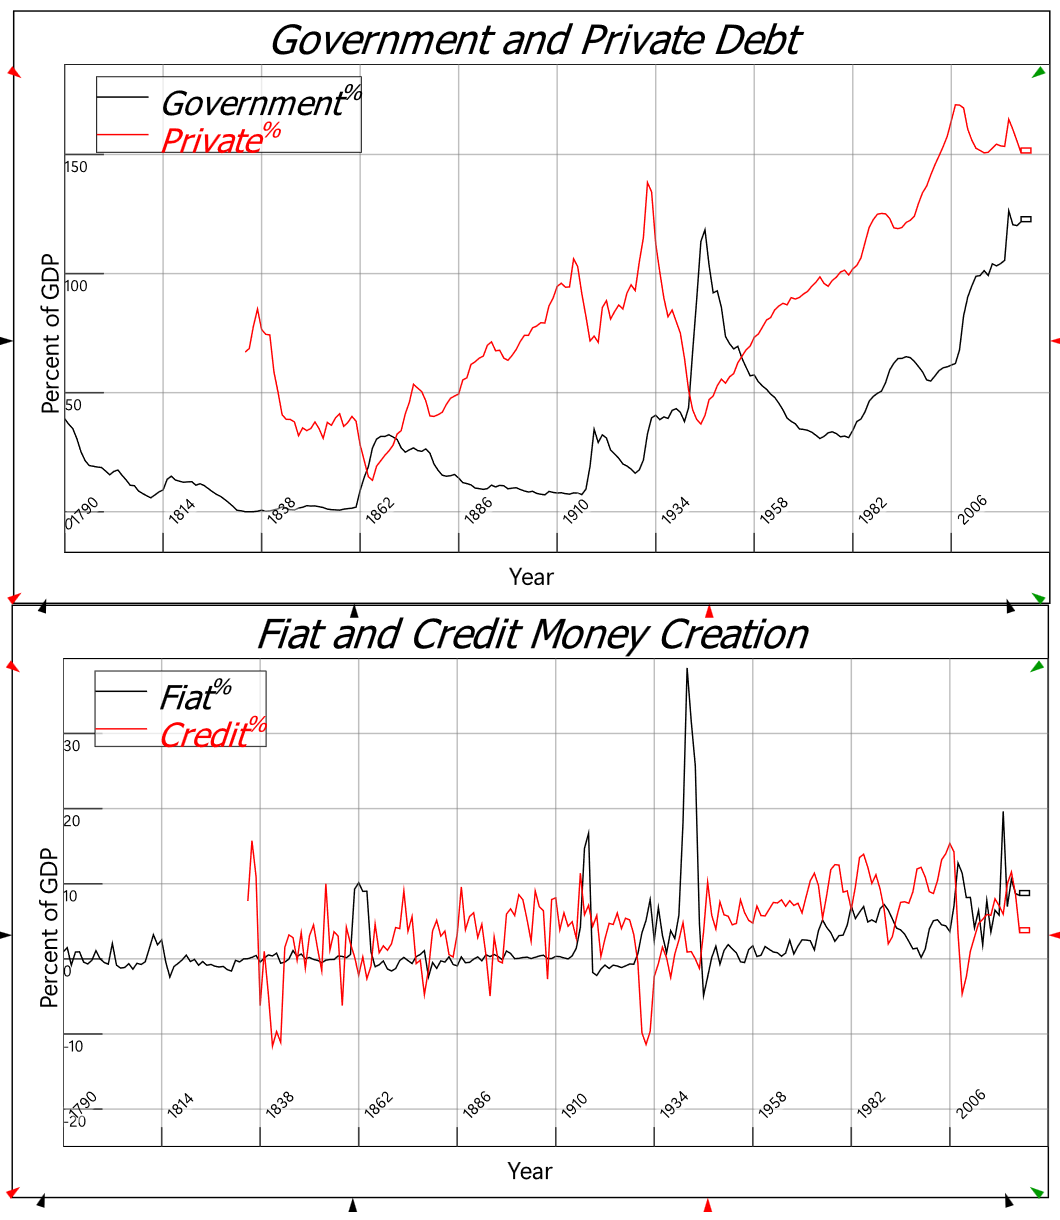
Figure 17: Private and Government Debt, Credit and Fiat Money Creation 1790-2023. See footnote 15 on page 27 for the data sources
Sharp and sustained downturns in credit-based money creation—with credit turning strongly negative and staying so for years—occurred in 1837-1844, 1930-37 and 2007-2010. These are known respectively as the “Panic of 1837”, the Great Depression, and the Global Financial Crisis. All three crises were preceded by periods during which the government either succeeded in reducing its debt by running surpluses (the Panic of 1837 and the Great Depression), or attempted to, but was waylaid by other factors (such as the “War on Terror” which derailed the attempts by Clinton and G.W. Bush to run surpluses in the late 90s and early 2000s).
During the 1920s, President Coolidge deliberately reduced government spending each year, with the surplus averaging of 1% of GDP across the decade. His final State of the Union Address, 68F[1] on December 4th, 1928, lauded these surpluses as both the cause of the 1920s boom, and as a guarantee of continued prosperity.
No Congress of the United States ever assembled … has met with a more pleasing prospect than that which appears at the present time…
Wastefulness in public business and private enterprise has been displaced by constructive economy… We have substituted for the vicious circle of increasing expenditures, increasing tax rates, and diminishing profits the charmed circle of diminishing expenditures, diminishing tax rates, and increasing profits.
Four times we have made a drastic revision of our internal revenue system… Each time the resulting stimulation to business has so increased taxable incomes and profits that a surplus has been produced. One-third of the national debt has been paid… It has been a method which has performed the seeming miracle of leaving a much greater percentage of earnings in the hands of the taxpayers 'with scarcely any diminution of the Government revenue. That is constructive economy in the highest degree. It is the corner stone of prosperity. It should not fail to be continued. {Coolidge, 1928 #6057. Emphasis added}
Ten months later, the Great Crash occurred, ushering in the Great Depression. While Coolidge had focused on reducing government debt, private debt, which was ignored by policy makers, rose substantially. Government surpluses of 1% of GDP, which reduced the money supply, had been offset by credit of roughly 5% of GDP, which increased it. Then credit turned strongly negative after the Great Crash, with the fall in private debt exceeding 10% of GDP in magnitude between 1930 and 1933. Despite this, the private debt to GDP ratio rose, because the fall in real output was amplified by deflation of 10% p.a., so that the fall in nominal GDP far exceeded the fall in private debt.

Figure 18: Debt, Credit, Fiat and Unemployment 1920-1940
Irving Fisher argued that the crisis was caused by private sector deleveraging from a position of excessive private debt, coupled with deflation:
deflation caused by the debt reacts on the debt. Each dollar of debt still unpaid becomes a bigger dollar, and if the over-indebtedness with which we started was great enough, the liquidation of debts cannot keep up with the fall of prices which it causes.
In that case, the liquidation defeats itself. While it diminishes the number of dollars owed, it may not do so as fast, as it increases the value of each dollar owed. Then, the very effort of individuals to lessen their burden of debts increases it, because of the mass effect of the stampede to liquidate in swelling each dollar owed. Then we have the great paradox which, I submit, is the chief secret of most, if not all, great depressions: The more the debtors pay, the more they owe. {Fisher, 1933 #152`, p. 344}
Fisher was well aware of the importance of bank-created money in fueling both booms when it is rising, and slumps when it is falling:
A man-to-man debt may be paid without affecting the volume of outstanding currency, for whatever currency is paid by one, whether it be legal tender or deposit currency transferred by check, is received by the other, and is still outstanding. But when a debt to a commercial bank is paid by check out of a deposit balance, that amount of deposit currency simply disappears. {Fisher, 1932 #4878`, p. 15}
Unfortunately, Fisher’s analysis was ignored by mainstream economists like Ben Bernanke on the basis of the model of Loanable Funds, in which lending is a “pure redistribution” that does not change the quantity of money:
The idea of debt-deflation goes back to Irving Fisher… Fisher's idea was less influential in academic circles, though, because of the counterargument that debt-deflation represented no more than a redistribution from one group (debtors) to another (creditors). Absent implausibly large differences in marginal spending propensities among the groups, it was suggested, pure redistributions should have no significant macroeconomic effects. {Bernanke, 2000 #1098`, p. 24}
Bernanke’s characterization of private debt as “pure redistributions” shows that he was thinking in terms of the false Loanable Funds model. The data shown in Figure 18 contradicts the claim that changes in private debt “should have no significant macroeconomic effects”, and it was available when Bernanke wrote those words.[2] In practice, only mavericks like Hyman Minsky {Minsky, 1982 #35} took Fisher seriously, and developed an approach to macroeconomics in which private debt had a significant role.
In general, the economics discipline continued to ignore private debt after the Great Depression, and even encouraged higher levels of private debt via arguments like the Modigliani-Miller hypothesis which, given the tax deductibility of interest payments, favored debt over equity finance {Modigliani, 1958 #6127}, and via the encouragement of derivatives as a means to manage risk {Yellen, 1996 #7440}. Between the end of WWII and the beginning of the “Great Recession” (a.k.a. the “Global Financial Crisis”), private debt rose from under 50% to over 170% of GDP—see Figure 19.

Figure 19: Private and Government Debt since WWII
The USA (and much of the rest of the world) then repeated the experience of the Roaring Twenties and Great Depression, this time in the form of the “Great Moderation” and the Great Recession. The Great Moderation was seen by mainstream economists as a positive development, with Bernanke arguing that “improved control of inflation has contributed in important measure to this welcome change in the economy”:
the low-inflation era of the past two decades has seen not only significant improvements in economic growth and productivity but also a marked reduction in economic volatility, both in the United States and abroad, a phenomenon that has been dubbed "the Great Moderation." Recessions have become less frequent and milder, and quarter-to-quarter volatility in output and employment has declined significantly as well… {Bernanke, 2004 #287}
That phenomenon ended abruptly when the GFC began in late 2007. Unemployment rose well above the level of the previous two recessions, and a spurt in inflation to over 5% suddenly gave way to a brief period of deflation, followed by low inflation until Covid—see Figure 20.

Figure 20: Inflation and Unemployment from 1990 till 2025
The same relationships between credit, fiat and unemployment that are evident in the 1920 to 1940 data shown in Figure 18 recurred across 1990 to 2015: see Figure 21. The correlation between credit and unemployment reached a staggering minus 0.93 between 1990 and 2015, while the correlation between unemployment and the government deficit—labelled Fiat in these plots because, as shown above, the government deficit is the means by which fiat-based money is created—was 0.76.
The positive relationship between unemployment and the government deficit reflects the fact that, unlike the simple simulations in the previous chapter, much of both government spending and taxation is non-discretionary: a recession causes tax revenues to fall and expenditure to rise. This “automatic stabilizer” effect, combined with some discretionary spending policies, saw the deficit rise from zero in Q2-2006 to 14.1% of GDP in Q2-2009: this was almost twice the size of the maximum deficit under the New Deal (7.9% of GDP in 1933). As shown in the previous chapter, this boosts the money supply, therefore counteracting the impact of a collapse in credit-based money. Therefore, to a large degree, the government deficit is driven by economic activity. This explains the positive correlation between the government deficit and unemployment: rising unemployment causes the government deficit to rise.

Figure 21: The staggeringly high correlations between credit and unemployment, and unemployment and fiat, between 1990 and 2015
It is obvious from the data that there is a relationship between credit and macroeconomic activity. But mainstream economists ignore the role of credit in macroeconomics because, in the model of Loanable Funds, credit redistributes existing spending power, but does not create new money nor add to aggregate demand. But in the real world in which banks create money when they lend, credit adds to aggregate demand and income. The next chapter explains the roles of both credit and government deficits in aggregate demand and aggregate supply.
[1] https://www.infoplease.com/primary-sources/government/presidential-speeches/state-union-address-calvin-coolidge-december-4-1928.
[2] Government debt data comes from the Treasury, which has maintained a record of government debt going back to 1789 https://fiscaldata.treasury.gov/datasets/historical-debt-outstanding/historical-debt-outstanding. No such consistent record exists for private debt, but a pseudo-series can be constructed back to 1817 using two disparate but overlapping data series from the US Census, and post-WWII data from the US Federal Reserve, as republished by the Bank of International Settlements: https://www2.census.gov/library/publications/1960/compendia/hist_stats_colonial-1957/hist_stats_colonial-1957-chX.pdf and https://data.bis.org/static/bulk/WS_TC_csv_col.zip. Normalizing the earlier private debt data to fit with current BIS private debt data yields Figure 16.