


Ravel now available for Mac & Linux as well as Windows
The spreadsheet and pivot table killer is now cross-platform

When we released Ravel in July 2024, there was only a Windows version. Now, Ravel is cross-platform: it runs on Windows, Mac, and Linux.
Ravel is a tool for the analysis of multidimensional data—data that can’t be shoehorned into the rows and columns of an Excel spreadsheet. For the last 40 years, the only way to transcend those limits was via a Pivot Table—a tool which very few spreadsheet users master.
Ravel transcends the Pivot Table with the Ravel: a graphical tool that makes it easy to navigate and examine data with multiple dimensions. The images below, prepared for a reaction video I’m recording to one of the most popular clips from Lex Fridman’s interview with me back in 2022, show what Ravel can do.
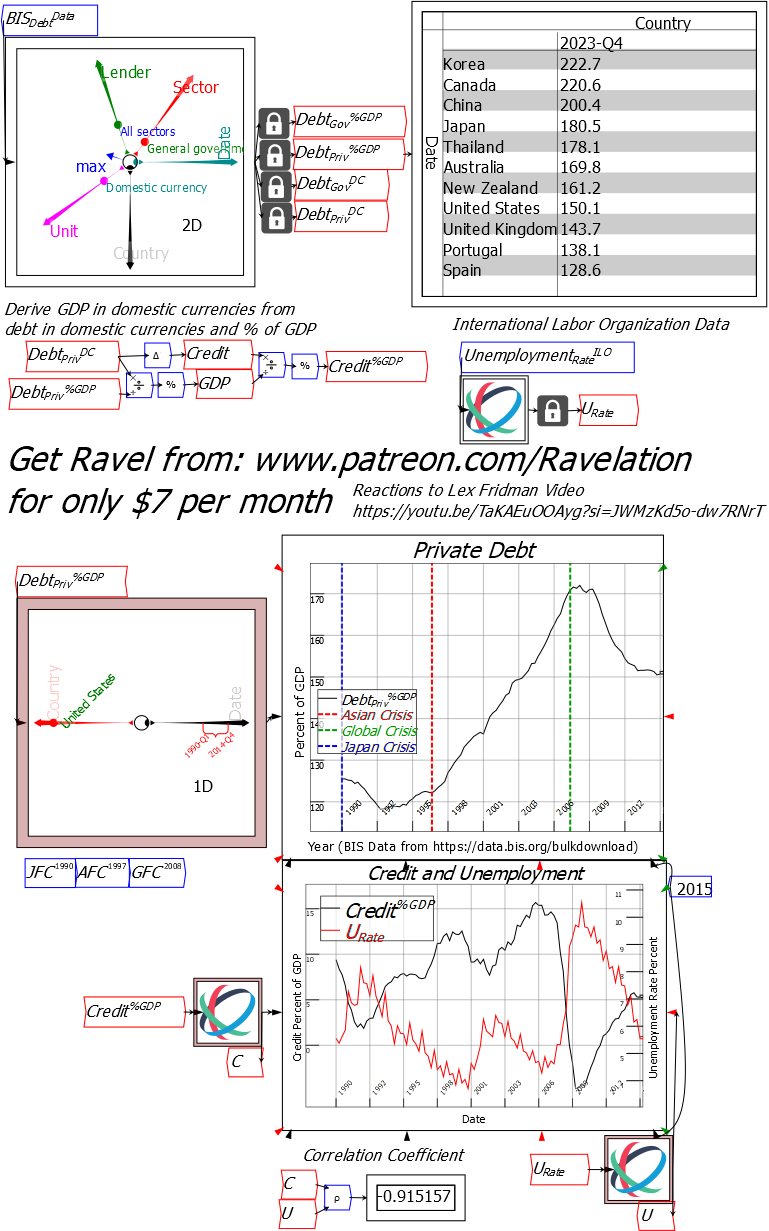
The top Ravel takes in data on debt from the Bank of International Settlements’ database, which has six dimensions—the Country (43 in total), the Sector doing the borrowing (Government, Private sector, Households), the Lender (Banks or All Lenders), the Unit (US$, domestic currency, percent of GDP), Valuation (Face value or Market), and Date (from 1948 by Quarter). The locks and attached variables then extract a number of 2-dimensional slices (Country and Date): government debt in domestic currencies and as a percentage of GDP, and the same for Private debt (for display purposes, I selected just 11 of these countries, using Ravel’s “Pick Slices” command).
A simple and easy to read set of flowchart equations then does some analysis that would be extremely cumbersome in a spreadsheet:

This easy to read set of flowchart equations:
derives GDP in domestic currencies—information that isn’t explicitly in the database—by a simple formula which divides debt in domestic currencies by the debt to GDP ratio in percent;
extracts the annual change in debt in domestic currencies and calls the result “Credit”; and
divides credit by GDP to derive credit as a percent of GDP
Moreover, it does that for every country and every quarter in the database: this operation would take thousands of replicated cell formulas in Excel.
Next, the International Labour Organization data on unemployment—for over 100 countries and 75 years, by Quarter—is imported. Another linked trio of Ravels—for debt, credit, and unemployment—enables a two-axis plot of credit against unemployment, and the calculation of the correlation coefficient.

What’s more, this graph and calculation is done for every country in the database: move the country selector dot to Japan, and you see its data—with the range of dates expanded, using what we call a “calliper”, to start in 1980 rather than 1990, since that was the beginning of Japan’s “bubble economy” period before its stock and housing markets crashed in 1990.

This would be an overwhelmingly difficult task to execute in Excel, and even in a business intelligence program like Tableau. It is a breeze in Ravel.
If you’d like to check out Ravel for yourself, sign up at https://www.patreon.com/ravelation for a mere $7 per month. There’s a free 7-day-trial membership as well, and in addition, the version of Ravel you download will work for up to 90 days, depending on our development cycle (the current version will last 81 days from today).
Note: there is a slight glitch in the install process at present: if you already have Ravel and you choose to Upgrade to get the latest version, it will initially upgrade the platform (Minsky) but show “Ravel Unavailable”. Do the Upgrade process a second time and Ravel will be installed. Russell Standish—Ravel’s programmer extraordinaire—will attempt to fix this glitch shortly.
Note: the port to Mac and Linux was generously funded by Dale Raaen (on Twitter as Mac-Tesla, @Dale_Raaen). Dale’s main interest is getting people to understand how money is created, which is the speciality of the Minsky platform on which Ravel is built. I’ll talk more about this aspect of Ravel in future posts.